Eight categorical colours in a fixed order, checked for colour-vision
deficiency separation between neighbours, plus the neutral inks used for
text, axes and gridlines. Every plot() method in the package uses them,
so figures read as one system; they are exported so your own figures can
match.
Usage
mm_palette(n = 8L, role = c("categorical", "ink"))Details
Assign the colours to series in order, and keep the assignment fixed to the series rather than to its rank. Three of them (aqua, yellow, magenta) have less than 3:1 contrast against a white background, so a figure using them should carry a legend or direct labels. Past eight series, fold the smallest into "Other" or use small multiples rather than inventing more colours.
Examples
mm_palette(3)
#>      blue    orange      aqua
#> "#2a78d6" "#eb6834" "#1baf7a"
mm_palette(role = "ink")
#>   surface   primary secondary     muted      grid      axis
#> "#fcfcfb" "#0b0b0b" "#52514e" "#898781" "#e1e0d9" "#c3c2b7"

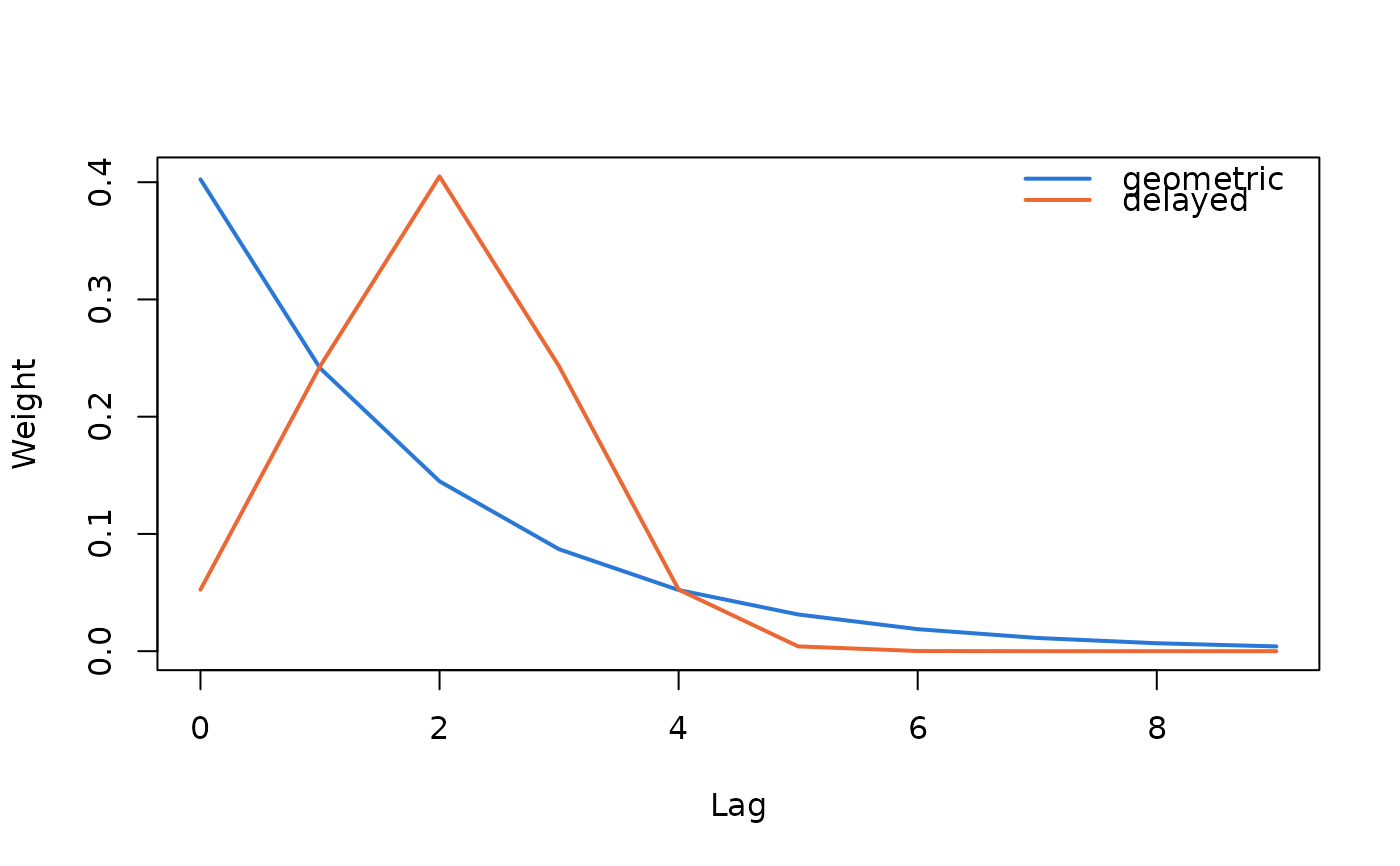
w <- rbind(geometric = adstock_weights(10, 0.6),
           delayed = adstock_weights_delayed(10, 0.6, peak = 2))
matplot(0:9, t(w), type = "l", lty = 1, lwd = 2, col = mm_palette(2),
        xlab = "Lag", ylab = "Weight")
legend("topright", rownames(w), col = mm_palette(2), lwd = 2, bty = "n")