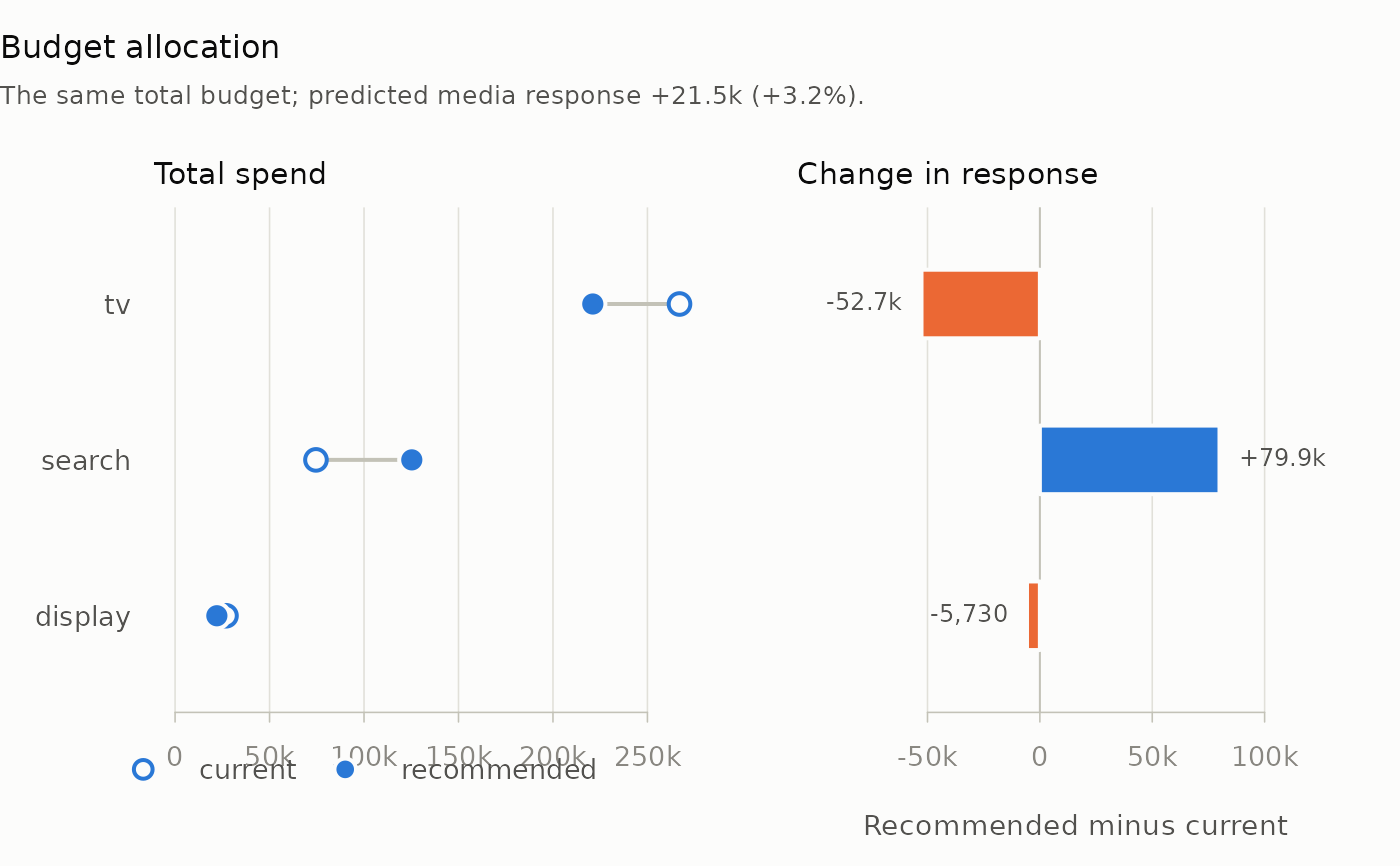
Two panels with one row per channel, largest recommended spend at the top. The first joins each channel's current spend (open) to its recommended spend (filled); the second shows the change in the channel's predicted response between the two, gains and losses in different colours.
Usage
# S3 method for class 'mm_allocation'
plot(x, ...)
Arguments
- x
An
mm_allocationobject fromallocate_budget().- ...
Graphical arguments:
mainreplaces the title, andcolgives two colours, the first for the spend markers and response gains, the second for response losses. Others are ignored.
Examples
data(mm_weekly)
north <- mm_weekly[mm_weekly$geo == "north", ]
truth <- attr(mm_weekly, "truth")
channels <- c("tv", "search", "display")
spec <- lapply(stats::setNames(channels, channels), function(ch) list(
  adstock = list(decay = truth$decay[[ch]]),
  saturation = list(half_max = truth$half_max[[ch]],
                    shape = truth$shape[[ch]])
))
plot(allocate_budget(north, spec, truth$beta, steps = 50))