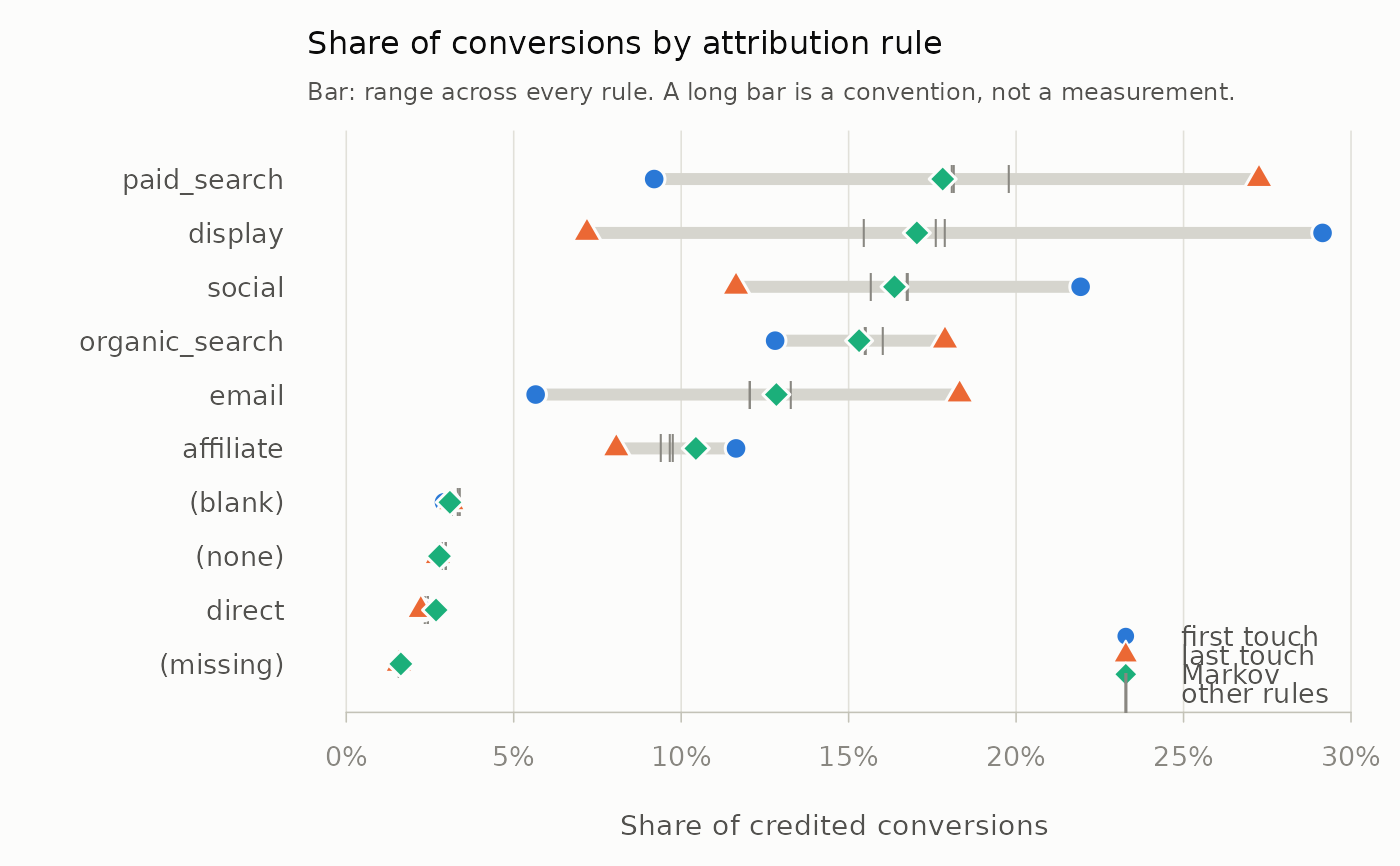
One row per channel. The grey bar spans the lowest to the highest share any rule gives it; first-touch, last-touch and Markov shares are marked, and the other rules appear as grey ticks. A long bar is a channel whose value depends on the convention, not the data.
Usage
# S3 method for class 'mm_attribution'
plot(x, n = 10L, ...)
Arguments
- x
A data frame from
attribute().- n
Show the
nchannels with the largest mean share.- ...
Ignored.
Examples
data(mm_events)
paths <- build_paths(mm_events, id = "customer_id", channel = "channel",
                     timestamp = "timestamp", conversion = "conversion")
plot(attribute(paths))