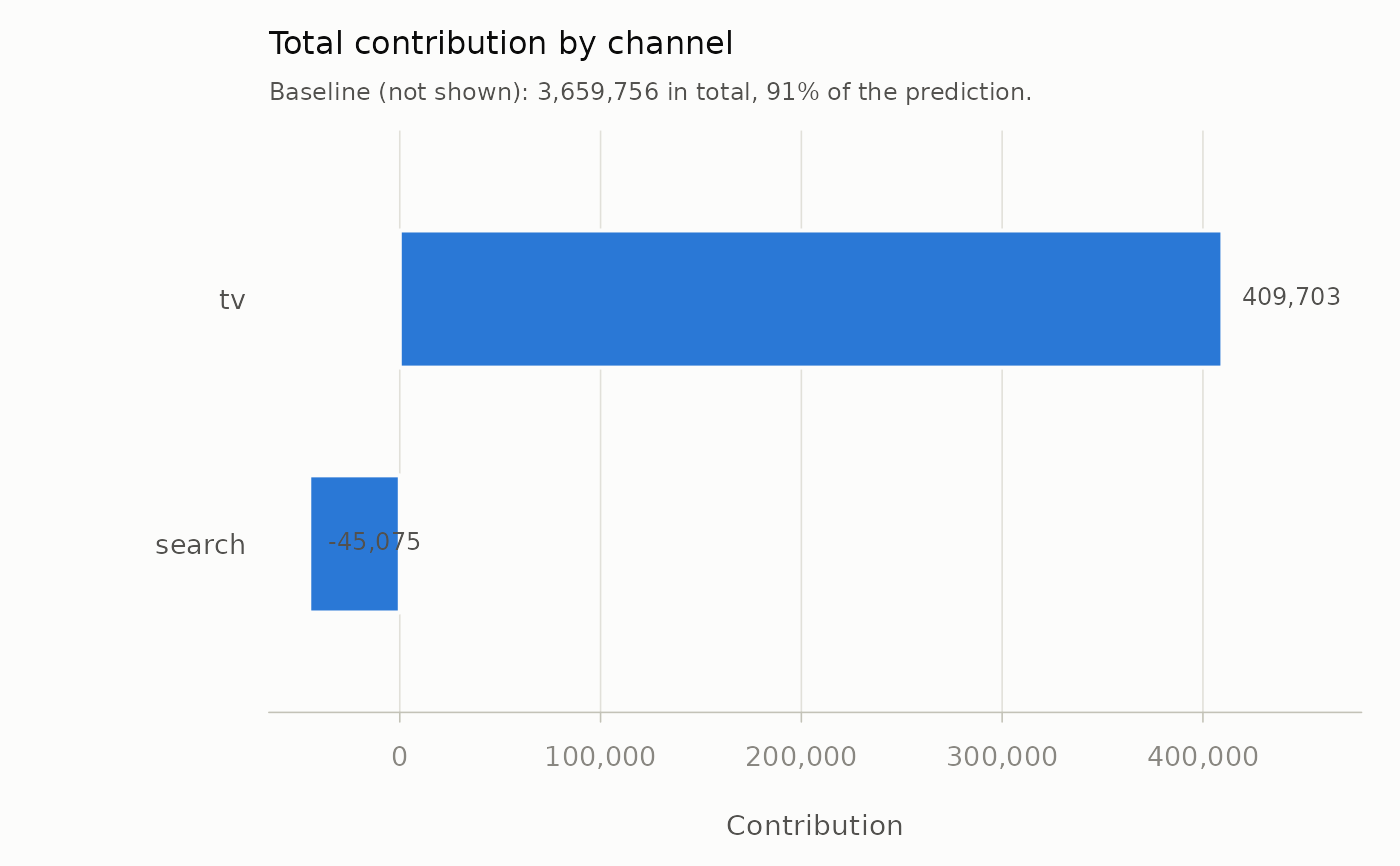
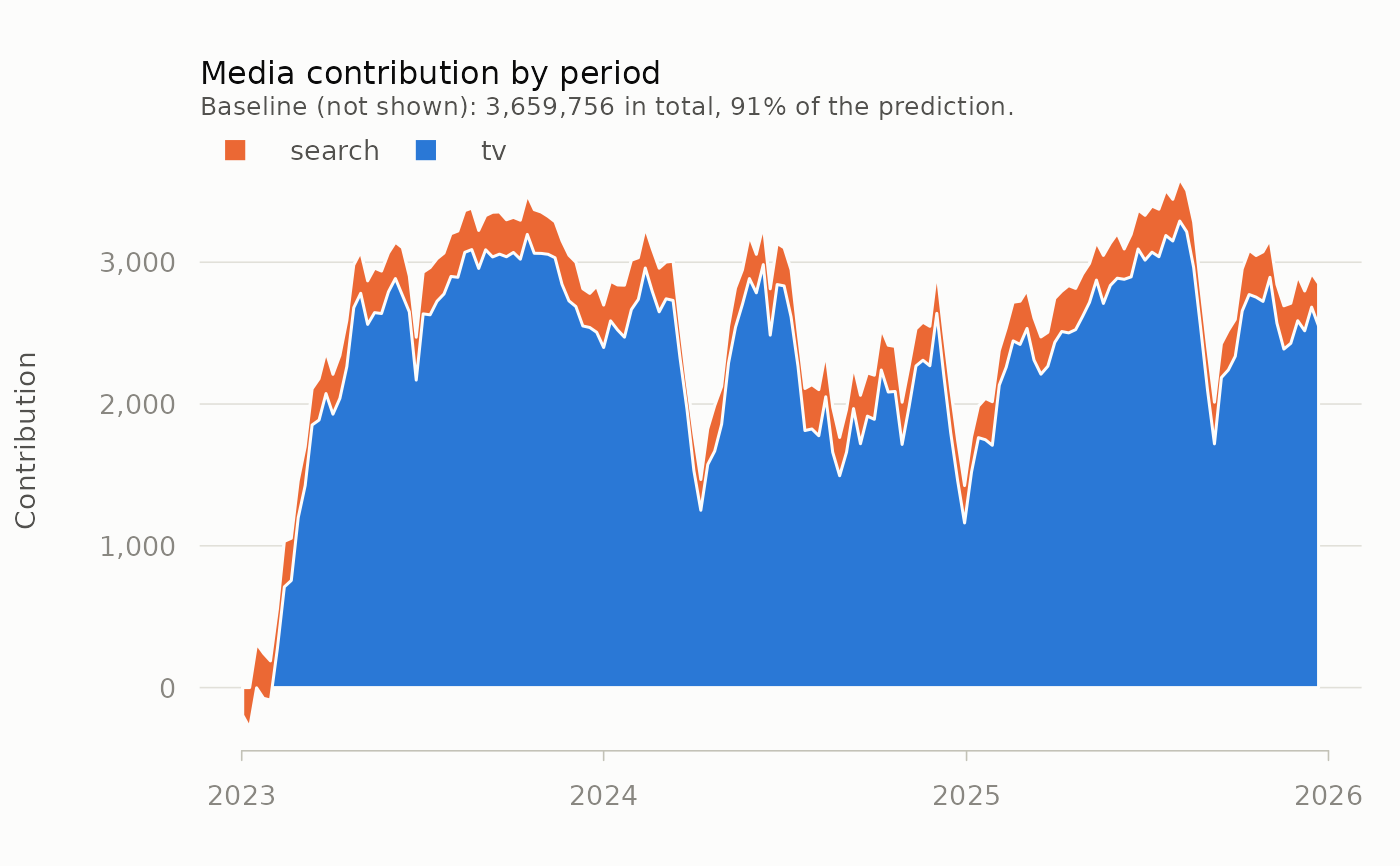
type = "time" stacks each channel's contribution period by period, which
shows when media worked; type = "total" compares channel totals. The
baseline is left out of both, because it is usually several times the size
of all media combined and would flatten everything else; its total is
reported in the subtitle.
Arguments
- x
A data frame from
contributions().- type
"time"(the default) or"total".- ...
Ignored.
Examples
data(mm_weekly)
north <- mm_weekly[mm_weekly$geo == "north", ]
ch <- c("tv", "search")
tr <- attr(mm_weekly, "truth")
media <- as.data.frame(Map(function(x, d, h, s) media_transform(
x, adstock = list(decay = d), saturation = list(half_max = h, shape = s)),
north[ch], tr$decay[ch], tr$half_max[ch], tr$shape[ch]))
fit <- lm(north$revenue ~ ., data = media)
contrib <- contributions(media, fit, index = north$date)
plot(contrib)
 plot(contrib, type = "total")