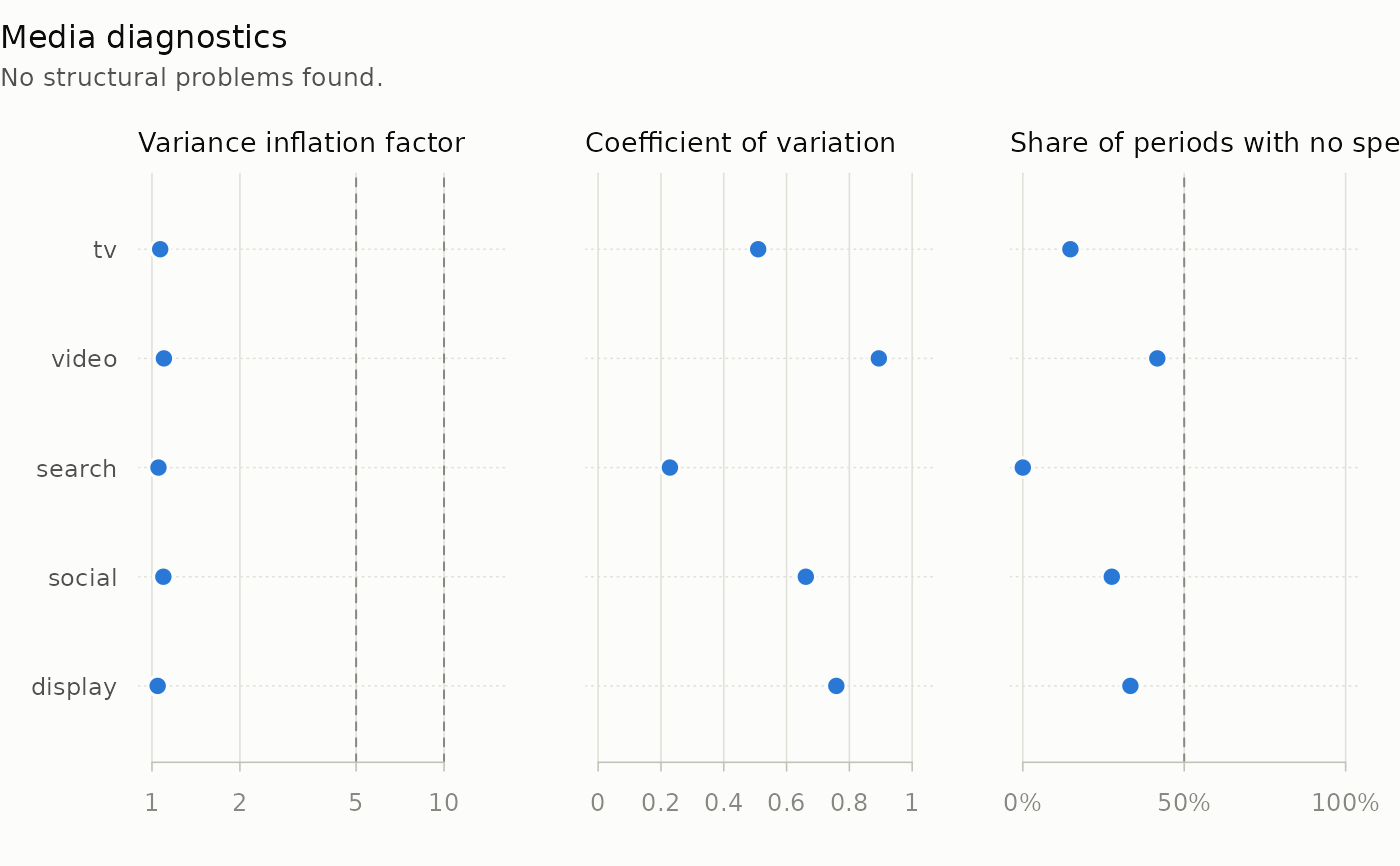
One row per channel, in three panels: the worst variance inflation factor
on a log scale, the lowest coefficient of variation, and the highest share
of periods with no spend. What diagnose_media() flagged is drawn as a red
triangle. When spend and impressions were supplied, a fourth panel counts
the periods whose implied cost per mille is an outlier, by spend column.
Usage
# S3 method for class 'mm_diagnosis'
plot(x, ...)
Arguments
- x
An
mm_diagnosisobject fromdiagnose_media().- ...
Graphical arguments:
mainreplaces the overall title andcolgives two colours, for unflagged and flagged values. Others are ignored.
Details
Dashed lines mark variance inflation factors of 5 and 10, the usual levels for attention and for a split between collinear channels that is not identified, and the 50% share of dark periods behind the flighting flag. The thresholds a run used are not stored with it, so the markers, not the lines, show what was flagged. A channel whose variance inflation factor could not be computed has no marker in the first panel, which is not the same as identified.
Examples
data(mm_weekly)
d <- diagnose_media(mm_weekly,
                    media = c("tv", "video", "search", "social", "display"),
                    by = "geo")
plot(d)