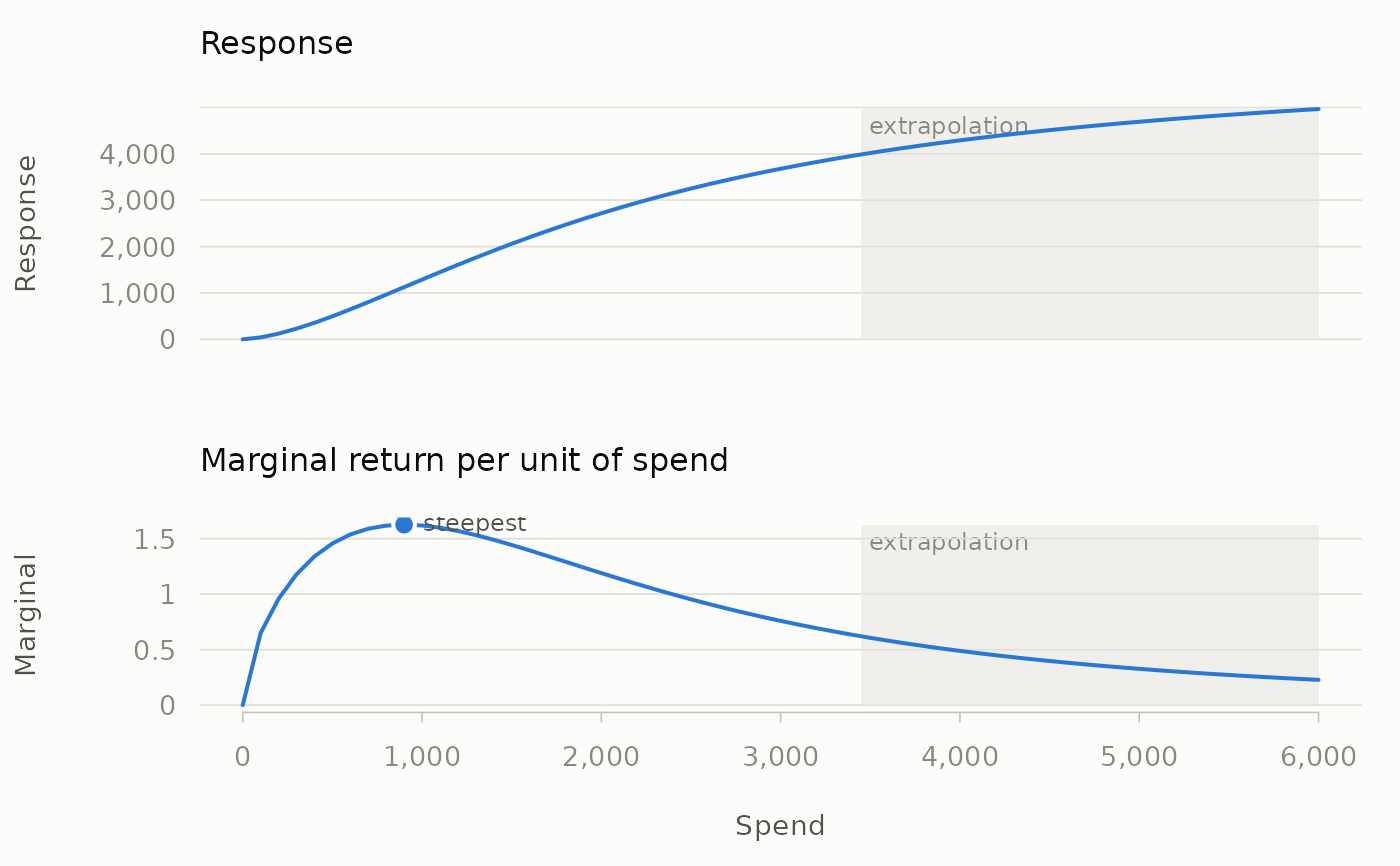
Two stacked panels on a shared spend axis: the response and its marginal return. Spend beyond the observed range is shaded, because there the curve is extrapolation.
Usage
# S3 method for class 'mm_response_curve'
plot(x, observed = NULL, ...)
Arguments
- x
A data frame from
response_curve().- observed
Optional numeric vector of the spend levels actually seen (for example the adstocked series); its range is left unshaded.
- ...
Ignored.
Examples
rc <- response_curve(seq(0, 6000, by = 100), coefficient = 6000,
                     half_max = 2250, shape = 1.6)
plot(rc, observed = c(0, 3450))