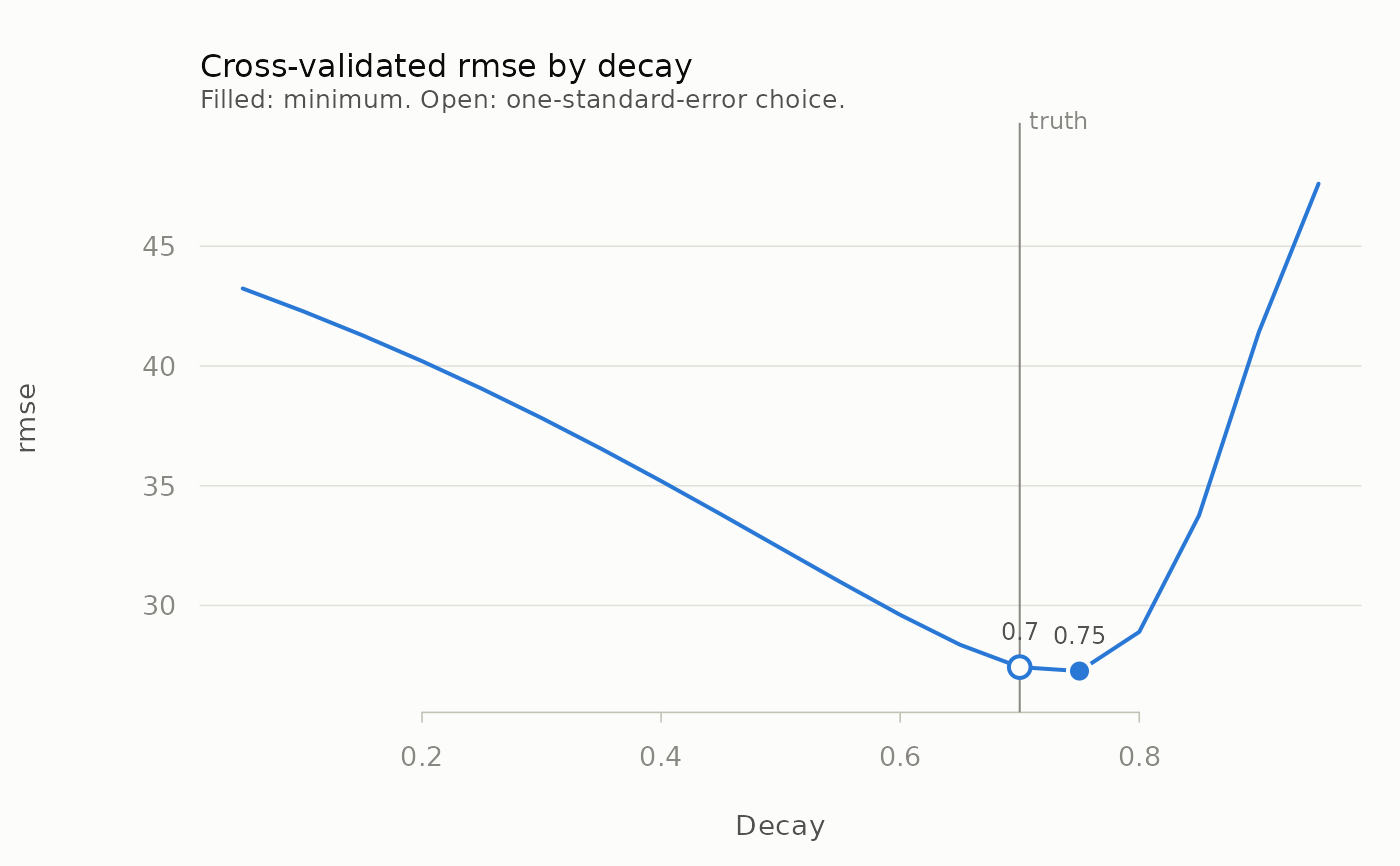
The cross-validated error across the decay grid, one line per max_lag,
with the minimum (filled) and the one-standard-error choice (open) marked
on the line they belong to. A flat profile is the finding: the data does
not pin carryover down, however precise best looks.
Arguments
- x
An object from
tune_carryover()ortune_carryover_joint().- truth
Optional known decay (a number, or for the joint version a vector named by channel), drawn as a muted reference line. Useful on simulated data.
- ...
Graphical arguments:
main,xlabandylabreplace the titles, andcolgives the line colours, one permax_lagin legend order. In the joint versionmainis the overall title andxlabandylablabel every panel. Others are ignored.
Details
With more than eight max_lag values, the seven with the lowest error keep
a colour each and the others are drawn as thin grey lines, with a message.
Examples
set.seed(42)
spend <- pmax(0, rnorm(120, 500, 250))
kpi <- 200 + 0.5 * adstock_geometric(spend, decay = 0.7) + rnorm(120, sd = 30)
tuned <- tune_carryover(spend, kpi, decays = seq(0.05, 0.95, by = 0.05))
plot(tuned, truth = 0.7)