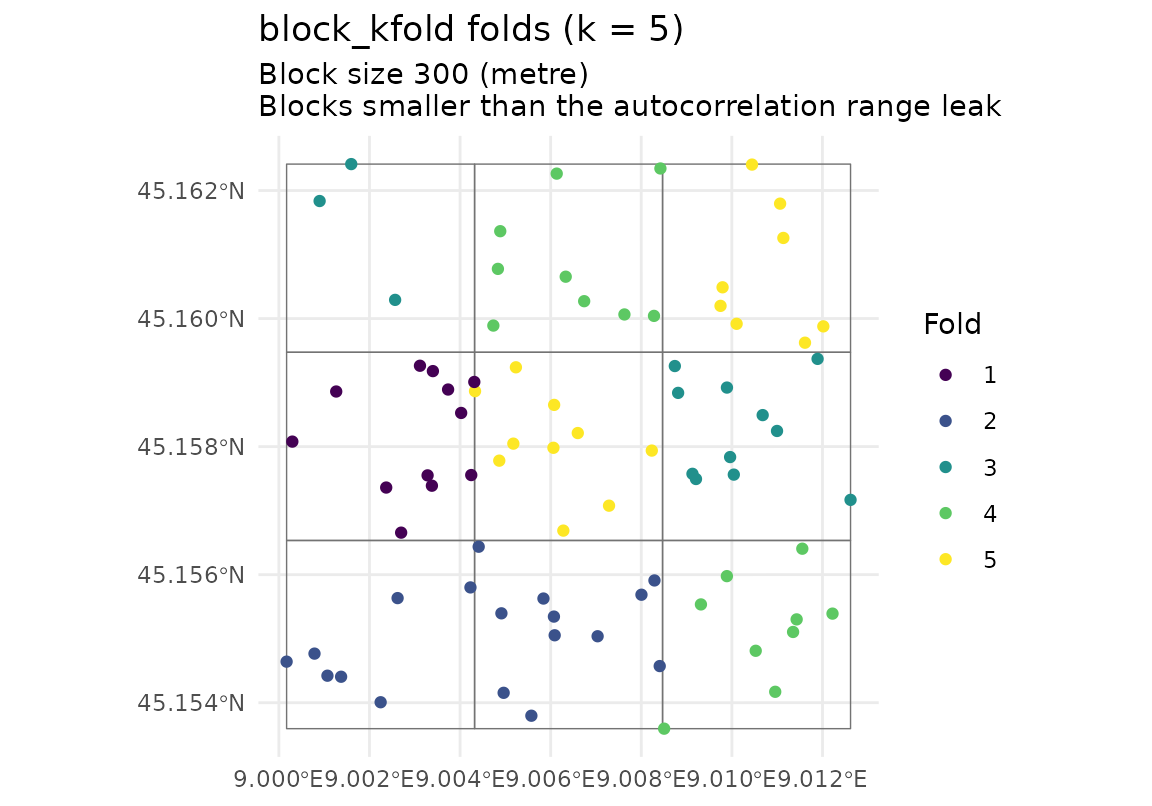
Shows which fold each observation belongs to. This is the fastest way to
see whether spatial blocks are actually separating the data, or whether the
blocks are smaller than the autocorrelation range and therefore leaking.
For "block_kfold" folds the block outlines are drawn too, from
folds$params$blocks, so a fold can be seen to be one region or
several and an empty block can be seen to be empty. The subtitle states
the parameter that decides whether the scheme leaks, read from
folds$params: the block size (and the estimated range when
auto_range found one), the buffer, the number of location groups,
or the median NNDM exclusion.
Arguments
- folds
A list returned by
make_folds().- points_sf
The
sflayer the folds were built from.- boundary
Optional polygonal
sf/sfcto draw underneath.- blocks
Logical; draw the block polygons when
foldscarries them. DefaultTRUE.
Examples
if (requireNamespace("ggplot2", quietly = TRUE)) {
  library(sf)
  set.seed(1)
  n <- 80
  pts <- st_as_sf(
    data.frame(x = 5e5 + runif(n, 0, 1000), y = 5e6 + runif(n, 0, 1000)),
    coords = c("x", "y"), crs = 32632
  )
  f <- make_folds(pts, k = 5, method = "block_kfold", block_size = 300)
  plot_folds(f, pts)
}