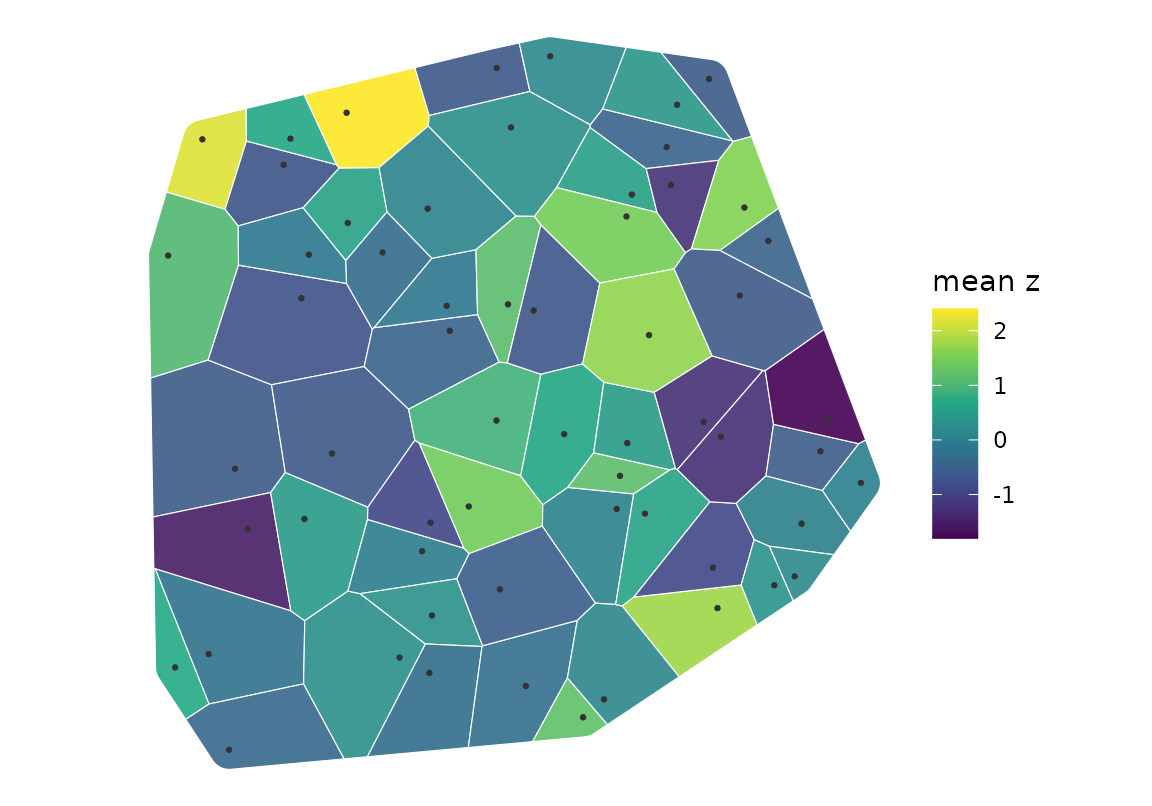
Plot a tessellation map with optional boundary, seeds, and features
Source:R/plotting.R
plot_tessellation_map.RdBuilds a layered ggplot2 map of polygon tessellations and optional overlays for a study boundary, seed points, and additional features.
Usage
plot_tessellation_map(
  tessellation_sf,
  boundary = NULL,
  seeds_sf = NULL,
  features_sf = NULL,
  fill_col = NULL,
  palette = "viridis",
  na_fill = "grey90",
  tile_alpha = 0.9,
  outline_col = "white",
  outline_size = 0.2,
  features_col = "#333333",
  features_size = 0.5,
  seeds_col = "#1f77b4",
  seeds_size = 1.5,
  boundary_col = "#111111",
  boundary_size = 0.6,
  labels = FALSE,
  label_col = NULL,
  label_size = 2.7,
  legend = TRUE,
  legend_title = NULL,
  theme = NULL,
  target_crs = NULL,
  title = NULL,
  subtitle = NULL,
  caption = NULL,
  xlim = NULL,
  ylim = NULL,
  expand = TRUE
)
Arguments
- tessellation_sf
An sf POLYGON/MULTIPOLYGON layer. Required.
- boundary
Optional sf/sfc polygon outline layer.
- seeds_sf
Optional sf/sfc point layer of seed locations.
- features_sf
Optional sf/sfc layer of additional features.
- fill_col
Name of the COLUMN in
tessellation_sfto map to fill;NULLfor no fill. A numeric column gets a continuous scale, as does a Date or POSIXct column (on a date or time axis) and aunitsordifftimecolumn (drawn as numbers, with the unit in the legend title); anything else a discrete one.fill_colandlabel_colname columns, whileoutline_col,features_col,seeds_colandboundary_colare colours.- palette
Viridis palette name. Default "viridis".
- na_fill
Fill for NA values. Default "grey90".
- tile_alpha
Alpha for filled polygons. Default 0.9.
- outline_col, outline_size
Colour and line width of the tessellation outline.
- features_col, features_size
Colour and point size of the feature overlay.
- seeds_col, seeds_size
Colour and point size of the seed overlay.
- boundary_col, boundary_size
Colour and line width of the boundary outline.
- labels
Logical; draw per-cell labels. Default FALSE.
- label_col
Name of the COLUMN holding the label text. Default
NULL: the first of"grid_id","cell_id","poly_id","polygon_id"and"id"the layer has, so the cells ofbuild_tessellation()(cell_id) and the output ofsummarize_by_cell()(poly_id) are labelled without naming one. Aunitsordifftimecolumn is drawn formatted, with its unit.- label_size
Label text size. Default 2.7.
- legend
Logical; show fill legend. Default TRUE.
- legend_title
Optional legend title.
- theme
A ggplot2 theme, or NULL (the default) to use
ggplot2::theme_void(). The default is resolved inside the function rather than in the formals, so that a Suggests package is never evaluated before therequireNamespace()check has run.- target_crs
Optional CRS for plotting. When
NULL(the default) the tessellation's own CRS is used, or (if the tessellation has none) a CRS borrowed from the first overlay that carries one, so a CRS-less grid drawn with located features still lines up. Any layer that arrives without a CRS is brought into the plot's CRS instead of being dropped: reprojected when its coordinates look like longitude/latitude, otherwise stamped with a warning, since a stamp assumes the coordinates were already in that CRS.- title, subtitle, caption
Plot annotations.
- xlim, ylim
Optional numeric vectors of length 2 for coordinate limits (in the plot CRS). Default NULL (auto).
- expand
Logical; expand plot area slightly beyond data limits. Default TRUE.
Examples
if (requireNamespace("ggplot2", quietly = TRUE)) {
  library(sf)
  set.seed(1)
  n <- 60
  pts <- st_as_sf(
    data.frame(x = 5e5 + runif(n, 0, 1000), y = 5e6 + runif(n, 0, 1000),
               z = rnorm(n)),
    coords = c("x", "y"), crs = 32632
  )
  # Cells from the points, the response aggregated onto them, and the map
  # shaded by the cell mean rather than by an arbitrary ID.
  tess  <- build_tessellation(pts, method = "voronoi", quiet = TRUE)
  cells <- summarize_by_cell(assign_features_to_polygons(pts, tess$cells),
                             response_var = "z", cells_sf = tess$cells)
  plot_tessellation_map(cells, features_sf = pts, fill_col = "resp_mean_z",
                        legend_title = "mean z")
}