Plot the path of a forward feature selection
Source:R/plotting-diagnostics.R
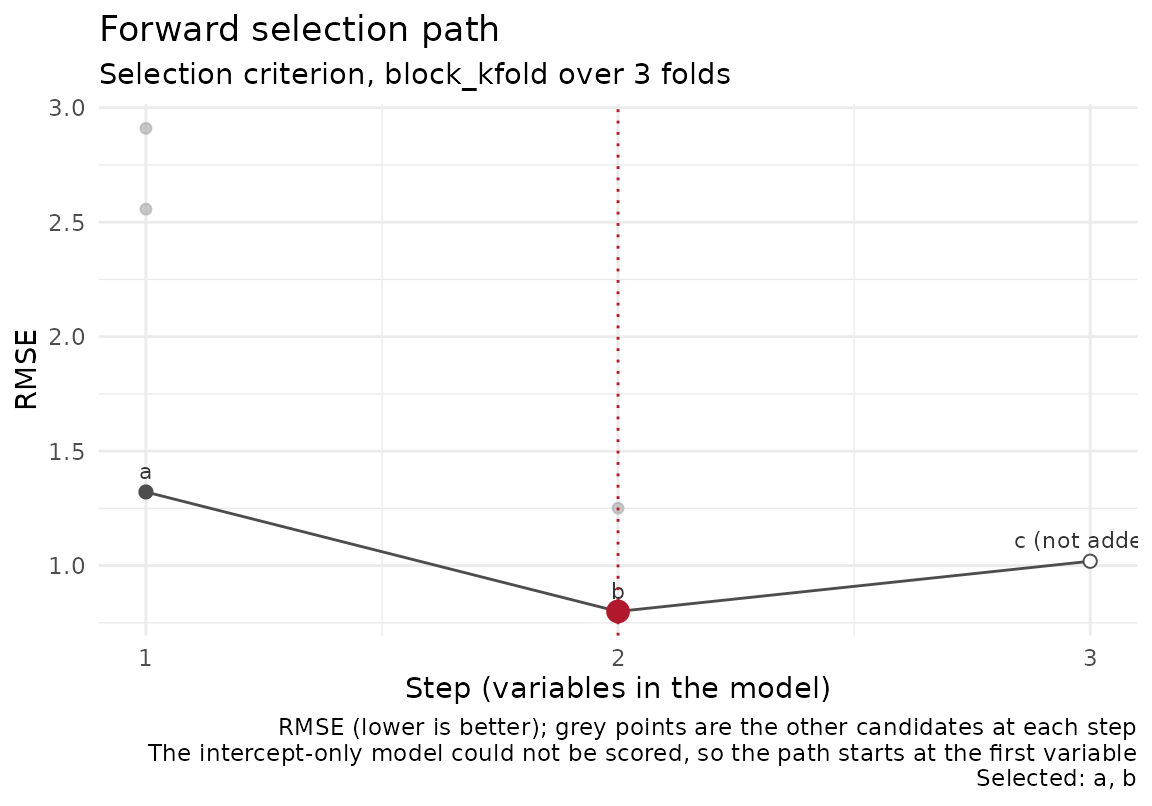
plot.feature_selection.Rdselect_features_forward() scores every candidate at every
step and keeps the best; its history holds all of them. This draws
the accepted variable's score at each step as the path, every other
candidate's score at that step as a faint point, and the step at which the
selection stopped in red. When it stopped because no candidate cleared
tol, the path runs one step further to the best of the rejected
candidates, drawn hollow and labelled "not added", so the stop reads as a
flattening rather than a cut. The picture then says whether the last variable
was a clear gain or the first that happened to clear tol, and
whether the runner-up would have done as well. The scores are the
selection's own cross-validated criterion, optimistically biased by the
selection (see the help page's section on that); when a hold-out score
was computed (select_on = "split") it is drawn as a separate mark
at the final step and named in the caption.
Usage
# S3 method for class 'feature_selection'
plot(x, ...)
Arguments
- x
The list returned by
select_features_forward().- ...
Ignored.
Examples
if (requireNamespace("ranger", quietly = TRUE) &&
    requireNamespace("ggplot2", quietly = TRUE)) {
  library(sf)
  set.seed(4)
  n <- 150
  dat <- st_as_sf(
    data.frame(x = 5e5 + runif(n, 0, 1000), y = 5e6 + runif(n, 0, 1000),
               a = rnorm(n), b = rnorm(n), c = rnorm(n)),
    coords = c("x", "y"), crs = 32632)
  dat$z <- 2 * dat$a - dat$b + rnorm(n, 0, 0.5)
  fit_fn <- function(train_sf, vars)
    fit_rf_model(train_sf, "z", vars, num_trees = 80, seed = 1)
  sel <- select_features_forward(dat, "z", c("a", "b", "c"), fit_fn = fit_fn,
                                 k = 3, quiet = TRUE)
  plot(sel)
}