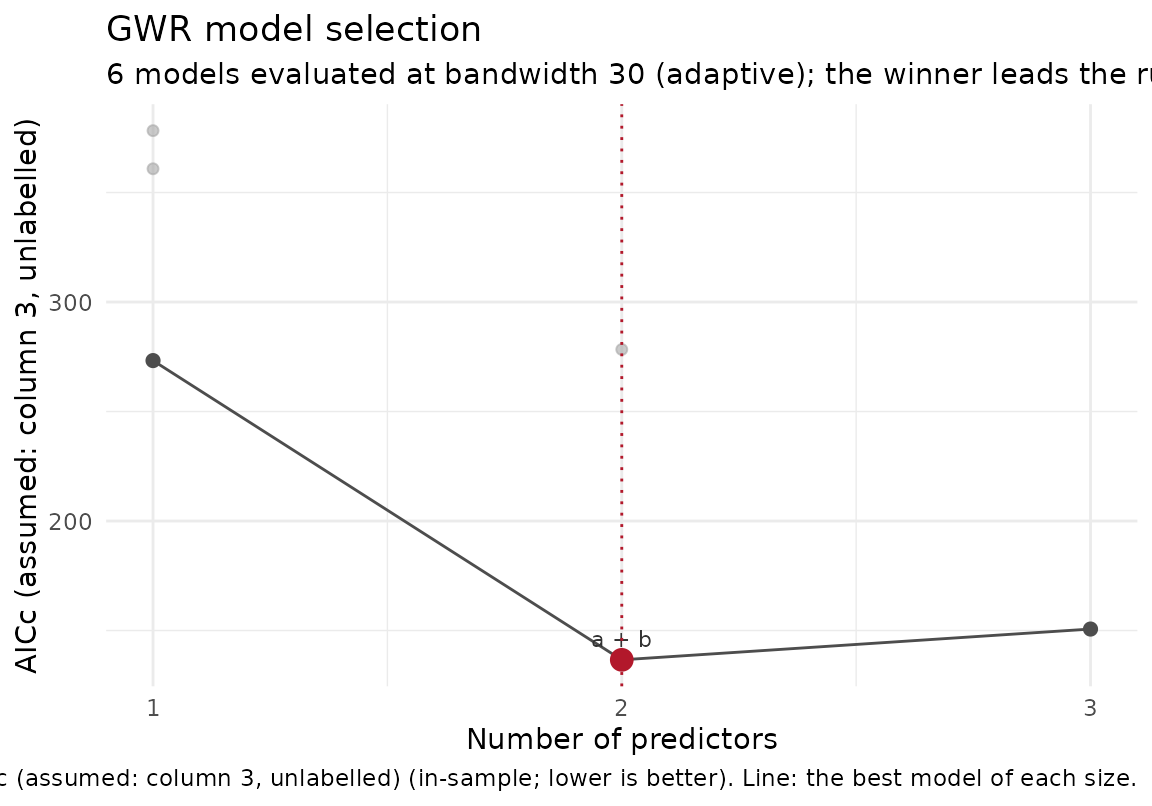
gwr_model_selection() ranks every model it evaluated on
AICc. This draws each model's criterion against its number of
predictors, the winner in red, so the gap between the best model and the
runners-up (which the ranked table shows only as numbers) is read
as a shape: a winner well below the rest was chosen by the data, a
winner a fraction of an AICc unit ahead of three others was chosen by the
tie-break. The criterion is in-sample and the caption carries the label
gwr_model_selection() attached to it, including any note saying it
was read positionally.
Usage
# S3 method for class 'gwr_model_selection'
plot(x, ...)Examples
if (requireNamespace("GWmodel", quietly = TRUE) &&
    requireNamespace("sp", quietly = TRUE) &&
    requireNamespace("ggplot2", quietly = TRUE)) {
  library(sf)
  set.seed(1)
  n <- 80
  dat <- st_as_sf(
    data.frame(x = 5e5 + runif(n, 0, 1000), y = 5e6 + runif(n, 0, 1000),
               a = rnorm(n), b = rnorm(n), noise = rnorm(n)),
    coords = c("x", "y"), crs = 32632)
  dat$z <- 2 * dat$a - dat$b + rnorm(n, 0, 0.5)
  sel <- gwr_model_selection(dat, "z", c("a", "b", "noise"), bandwidth = 30)
  # Every model tried, AICc against its size; the winner (a and b) marked.
  plot(sel)
}