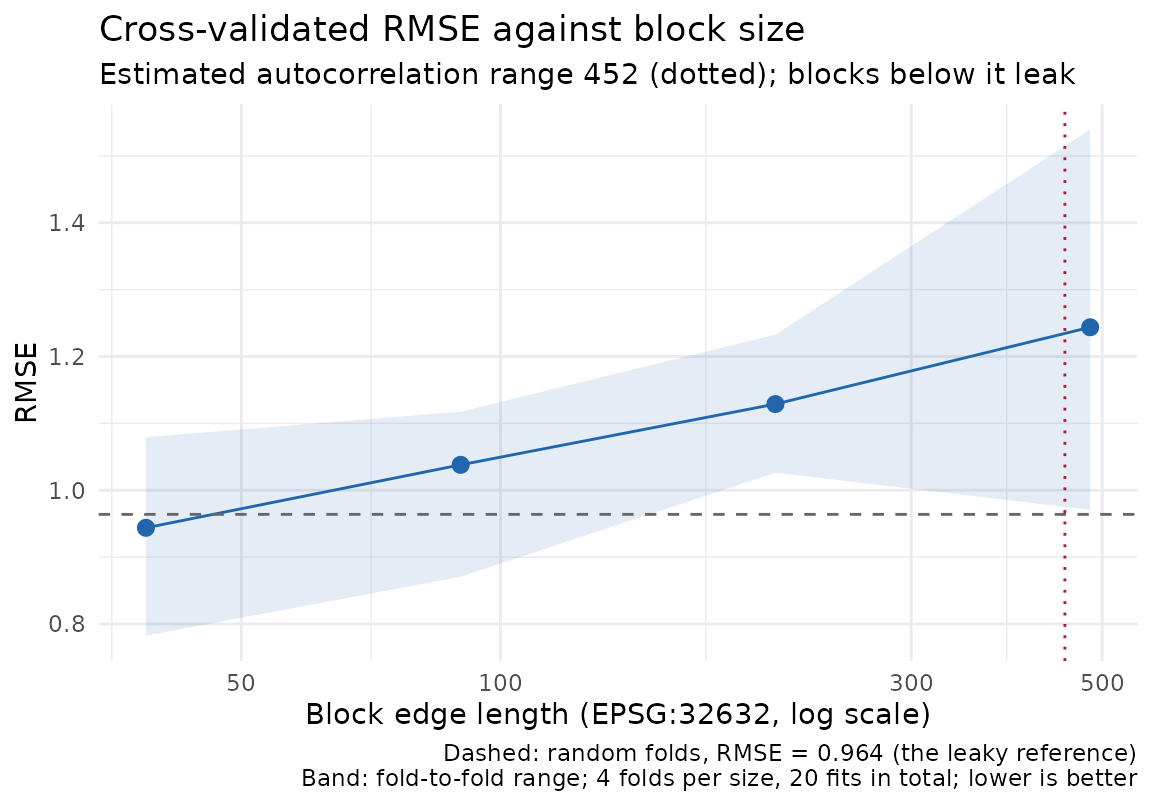
Plot cross-validation error against block size
Source:R/block-size-sweep.R
plot.block_size_sweep.RdThe curve from cv_block_size_sweep(): the pooled metric at
each block size, the fold-to-fold range as a band, the random-fold
reference as a dashed line, and the estimated autocorrelation range as a
vertical marker. Blocks smaller than the range leak, so the curve rises
from the reference towards the range and plateaus beyond it; the height
of the rise is what the random-fold number overstated. The caption says
which way is better: higher for R2 and Adj_R2, closer to
the nominal level for a coverage_* column (0.975 for
coverage_97.5), since over-coverage is miscalibration too, and
lower for everything else.
Usage
# S3 method for class 'block_size_sweep'
plot(x, ...)Examples
if (requireNamespace("ranger", quietly = TRUE) &&
    requireNamespace("gstat", quietly = TRUE) &&
    requireNamespace("ggplot2", quietly = TRUE)) {
  library(sf)
  set.seed(1)
  n <- 200
  x <- 5e5 + runif(n, 0, 1000); y <- 5e6 + runif(n, 0, 1000)
  d <- as.matrix(dist(cbind(x, y)))
  field <- as.numeric(t(chol(exp(-d / 100) + diag(1e-6, n))) %*% rnorm(n))
  dat <- st_as_sf(data.frame(x = x, y = y, a = rnorm(n)), coords = c("x", "y"),
                  crs = 32632)
  dat$z <- field + 0.5 * dat$a + rnorm(n, 0, 0.2)
  rf_fn <- function(train_sf)
    fit_rf_model(train_sf, "z", "a", include_coords = TRUE, num_trees = 100,
                 seed = 1)
  sw <- cv_block_size_sweep(dat, "z", "a", fit_fn = rf_fn, k = 4, n_sizes = 4,
                            quiet = TRUE)
  # Error rises from the random-fold reference (dashed) as the blocks grow
  # towards the estimated autocorrelation range (vertical marker).  The
  # height of that rise is what random folds were hiding; with four sizes the
  # ladder stops near the range, so the plateau beyond it is not drawn here.
  plot(sw)
}